 Many of our past posts have discussed marketing, retail environments, sign design, content and audio considerations. But why is this dynamic sign technology getting so much attention? Why should you invest in this new learning curve as a digital print or sign professional? From software selection, to network design and configuration, to the right displays and peripherals and then installation and training for the client, it is quite an investment. Is it worth it? Okay, let’s march a few statistics out for March, and then you decide…. (We’ll use plenty of pictures to keep it lively!)
It is no coincidence that with 74% of all purchase decisions in mass merchandisers made in store, an increasing number of brand marketers and retailers invest in this medium.
When electronic digital signage first came onto the scene a few short years ago, there was no way to quantify it in terms of return on investment or impact on the marketplace, or even consumers. With the advent of scanner technology, brand marketers and retailers have been able to immediately determine the effectiveness of P.O.P.
POPAI‘s studies, undertaken from 1994 through this year, have consistently demonstrated significant sales increases for products supported by Retail Marketing across industries and geography.
Digital Signage has been proven to reduce perceived wait time by 40%-60%. That makes for happier, friendlier, more relaxed, and more satisfied clients.
 At the same time, you have a unique opportunity to tell your audience about additional products and services you offer. You can be sure they’ll remember… it’s proven that digital signage can increase ad recall by more than 60%. And in case you’re wondering about the bottom line: Digital signage increases sales by 18%-62%!
InfoTrends/CAP Ventures has been tracking the industry since 1999, and adjusted Compound Annual Growth Rates are over 30%.
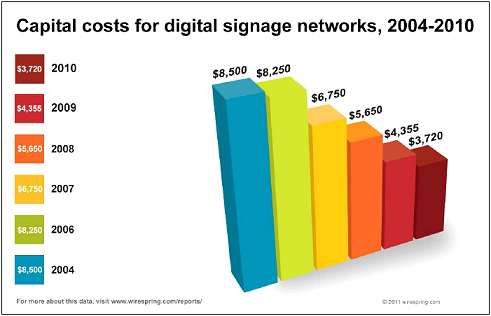
And, the most recent Digital Signage Pricing Report from Wirespring shows that the cost to deploy displays has dropped 14%. When Wirespring first began tracking in 2004, the cost per node (screen and media player) averaged $8500. In 2010, this had dropped to $3720.
It was only a few short months ago that Walmart released some information pertaining to their (in)famous Smart Network. In case you missed the announcement, the company calculated the following percentage increases in store departments using the Smart Network:
- Electronics: 7%
- Over-the-counter: 23%
- Food: 13%
- Health/beauty: 28%
They also disclosed the point in a product’s life cycle when the network seemed to be most effective:
Sales lift by product type
- Mature items: 7%
- Newly-launched items: 9%
- Seasonal items: 18%
- Items on rollback: 6%
From two case studies on how the Smart Network affects product sales (thanks to Digital Signage Today for the summaries):
In the first, a breathing-strip manufacturer purchased an endcap campaign, in which a 90- to 120-second message ran on endcap screens with product positioned around it. While the program was running, the brand saw a 100 percent sales lift on the specific product, determined by testing versus a control group.
In another campaign, the retailer wanted to increase the number of shoppers that opted in to receive discounts and offers via SMS. It staged a four-week campaign in which shoppers were told that if they’d sign up by dialing a specific code, they’d get exclusive announcements of new “Rollback” offers. During the four-week period, the retailer saw a three-fold increase in daily opt-ins.
Still with me here? We’re giving you this so you can go forth and conquer your clients’ fears! Okay, how about YOUR fears 😉 Check this out:
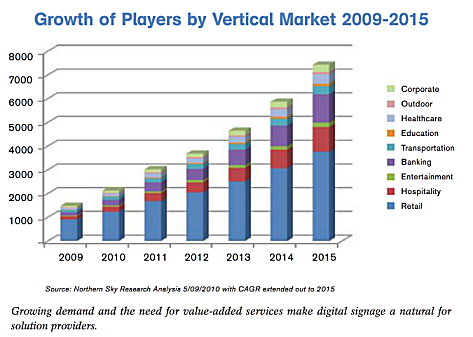
According to data cited by Microsoft’s Edson, there are approximately 2 million digital signs across the US right now, and that number is expected to grow to 7 million over the next 5 years. For that to happen in a nice, linear fashion, it would mean that the industry will deploy 1,000,000 screens every year for the next 5 years.
The above chart shows that Retail remains the largest piece of the digital sign pie, and that Hospitality is second. With Retail, we find every imaginable style of display – from kiosks and endcaps, to video walls and window projections. In Hospitality, the range is not so dramatic. Both present ready opportunities for digital sign professionals.
Hopefully this March round-up of current research has given you a new perspective on your own potential in this arena. Next post, a bit about technology as it relates to content…


